From Paris with love and analytics or what we learned at VivaTech
ABOUT EVENTS
On June 15-18, a powerful VivaTechnology startup event took place in Paris (detailed information about the event is available on the website vivatechnology.com).
We offer an analysis of the startup market as of the first half of 2022 based on open data submitted by the teams participating in the event.
GEOGRAPHY
1700+ startups from more than 60 countries of the world were registered to participate in VivaTech. Most of them were from France. Ukraine was represented by 17 startups. You can see the geography of the participants in detail on the chart below.
STARTUP PROFILE
1. Team
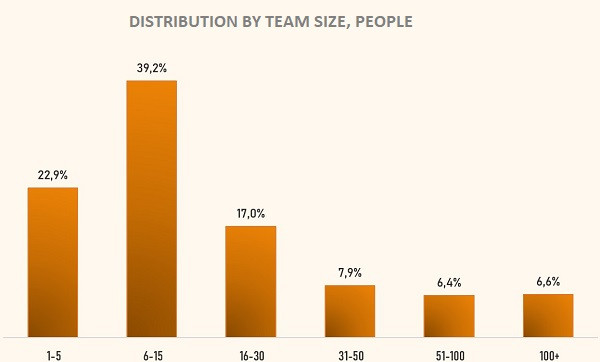
The average number of team members is 6-15 people.
Distribution by team size, people
2. Market experience
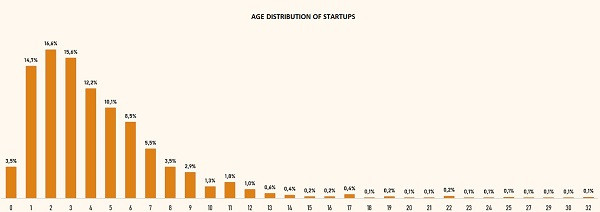
The average age of registered startups is 1-3 years. Although, 32-year veterans of the startup movement were also represented.
Distribution by startup age
3. Developmental stages.
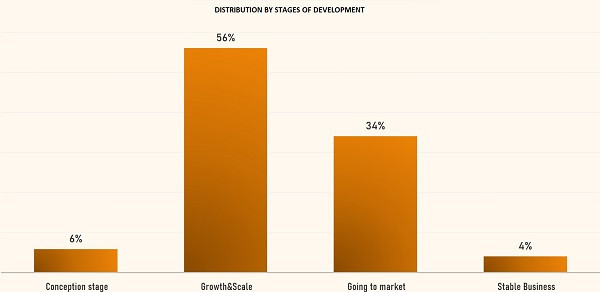
We can see that the vast majority of startups participating in VivaTech are either already being scaled up or entering the market, i.e., at least, have an MVP. There are very few startups which are at the conceptual stage - only 6%.
Distribution by developmental stages
MARKET AREAS AND TRENDS
The organizers divided the spheres of startup activities into 37 areas, from conventional areas (such as artificial intelligence and health care) to quite exotic ones, such as AfricaTech.
Environment GreenTechAR VR MetaverseData managementB2B ServicesEducationAI Machine Learning5G ConnectivityLuxuryDiversity InclusionFintech BankingIndustry Supply ChainHealthcareEntertainment Gaming Arts CultureEuropaTechEnergyBlockchain NFT Crypto Web3Future of WorkCustomer EngagementAnalyticsAfricaTechDeep TechMarketing Advertising MediaGovTech Public sectorCybersecurityCloud InfrastructureFood AgricultureMobility Smart CitiesSaasCRM / ERPIoTRetail E-commerceRoboticsSpace AeronauticsInsurance LegalPersonal ServicesScaling UpTravel Tourism
This year's TOP-5 most popular areas include:
- AI Machine Learning
- B2B Services
- Environment GreenTech
- Saas
- Healthcare
The products presented by the teams are essentially a convergence of different technologies and areas. Therefore, the most interesting thing is the analysis of interaction, interrelationship of different areas. An interactive chord diagram is presented below. In order to have a detailed look at the relationships, click on individual segments of the diagram.
A chart showing the distribution of the related areas, which were most frequently mentioned in the description of the startup, will be drawn up below.

AI Machine LearningB2B ServicesEnvironment GreenTechSaasHealthcareMobility Smart CitiesDeep TechRetail E-commerceIoTAR VR MetaverseIndustry Supply ChainFuture of WorkEnergyData managementBlockchain NFT Crypto Web3Fintech BankingMarketing Advertising MediaEducationScaling UpEntertainment Gaming Arts CultureCustomer EngagementAnalyticsFood AgricultureDiversity InclusionCybersecurityCloud Infrastructure5G ConnectivityGovTech Public sectorRoboticsAfricaTechSpace AeronauticsLuxuryInsurance LegalCRM / ERPTravel TourismEuropaTechPersonal Services
We see a high level of interrelationship. This proves the thesis that today's innovative products go beyond the individual areas and develop in an interdisciplinary manner.
We remind you that you have an opportunity to create your own product, test a hypothesis, implement your idea and make your technological dream come true together with Noosphere Engineering School!
Інші новини
Підписуйтесь для отримання останніх новин
Бажаєте реалізувати свій проєкт?
Зв'яжіться з нами і ми допоможемо втілити ваші ідеї в життя!